pytorch

pytorch和神经网络学习笔记。

安装

官网地址:Start Locally | PyTorch

例如:

1
pip3 install torch torchvision torchaudio --index-url https://download.pytorch.org/whl/cu118

如果网络老是中断,可以先从.whl文件安装torch

1
pip install D:\Users\xxx\Downloads\torch-2.1.0+cu118-cp311-cp311-win_amd64.whl

然后在执行第一个命令,安装torchvision torchaudio。

神经网络概述

DNN (Deep Neural Network)、RNN (Recurrent Neural Network)、CNN (Convolutional Neural Network) 和图神经网络 (Graph Neural Network) 都是深度学习领域中常见的神经网络架构,它们各自适用于不同类型的数据和任务。以下是对每种神经网络的简要介绍:

  1. 深度神经网络 (DNN):
    • DNN是一种标准的前馈神经网络,它由输入层、多个隐藏层和输出层组成。
    • DNN广泛用于图像分类、文本分类、回归、语音识别等任务。
    • 深层结构允许DNN从数据中自动学习高级特征表示,从而提高性能。
  2. 循环神经网络 (RNN):
    • RNN是一种递归神经网络,具有循环连接,能够处理序列数据。
    • RNN具有内部状态,允许它记忆先前的信息并将其传递到后续时间步。
    • RNN常用于自然语言处理 (NLP)、时间序列分析、语音识别等需要考虑上下文的任务。
  3. 卷积神经网络 (CNN):
    • CNN是专门设计用于图像处理的神经网络。
    • 它使用卷积层来检测图像中的特征,如边缘、纹理和形状。
    • CNN在计算机视觉任务中表现出色,如图像分类、目标检测和图像分割。
  4. 图神经网络 (Graph Neural Network, GNN):
    • GNN是为处理图数据而设计的神经网络,如社交网络、知识图谱和分子结构。
    • GNN能够在节点和边上执行信息传递,考虑了图数据的拓扑结构。
    • GNN用于图分类、节点分类、链接预测等任务,并在推荐系统和生物信息学中也有广泛应用。

基本成员

Tensor

1
.cuda()

Module(Model)

1
.cuda()

optim

SGD

1
2
3
4
5
6
7
8
9
10
11
12
13
14
15
16
#1. 创建模型
net = LSHModel(feature_dim, hidden_dim)
optimizer = optim.SGD([{'params': net.parameters()}], lr=0.1)

#2. 训练
for a, b in train_data*100:
loss = net(a, b, True)
print(loss)

# compute gradient and do SGD step
optimizer.zero_grad()
loss.backward()
optimizer.step()

#3. 保存模型参数
torch.save(net.state_dict(), 'LSH.pt')

基本方法

randn

1
torch.randn(5, 3, 224, 224) -> tensor

预设模型

torchvision.models

1
2
3
4
5
6
7
8
9
10
11
12
13
14
15
16
17
18
19
20
21
22
23
24
resnet18()
AlexNet: 一种深度卷积神经网络,用于图像分类。它是深度学习的里程碑之一,拥有多层卷积和池化层。

VGG: 基于卷积神经网络的一系列模型,包括 VGG11、VGG16 和 VGG19,用于图像分类。它们都具有深度卷积结构。

ResNet: 残差网络是一种非常深的卷积神经网络,通过引入残差块,克服了深度神经网络的退化问题。包括 ResNet18、ResNet50 等不同深度的模型。

DenseNet: 密集连接网络,将每一层的特征图与前面所有层的特征图连接,从而实现了更好的信息传递。

Inception (GoogLeNet): Inception 模型是一种具有多个分支的网络,用于同时提取不同尺度和类型的特征。

MobileNet: 非常轻量级的卷积神经网络,适用于移动设备和嵌入式系统。

ResNeXt: ResNeXt 模型是一种卷积神经网络,引入了组卷积的概念,以提高模型的性能。

ShuffleNet: 一种具有轻量级网络结构的模型,适用于资源受限的环境。

SqueezeNet: 另一个轻量级神经网络模型,具有较少的参数和计算量。

Wide ResNet: 基于 ResNet 的变种,拥有更宽的网络结构,以提高性能。

InceptionResNetV2: 结合了 Inception 和 ResNet 的特点,具有较高的性能。

MNASNet: 一种轻量级的神经网络,适用于移动设备和嵌入式系统。

常用模型

LSHModel

局部哈希敏感模型

1
2
3
4
5
6
7
8
9
10
11
12
13
14
15
16
17
18
19
20
21
22
23
24
25
26
27
import torch
import torch.nn as nn
import torch.nn.functional as F


class LSHModel(nn.Module):
def __init__(self, feature_dim, hidden_dim):
super(LSHModel, self).__init__()
self.linear = nn.Linear(feature_dim, hidden_dim)
self.loss = nn.MSELoss()

def euclidean(self, x, y):
return torch.sqrt(torch.sum((x-y)**2))

def similarity(self, distance):
return 1 / (1 + distance**0.5)

def forward(self, x, y, train=False):
output_x = self.linear(x)
output_y = self.linear(y)
distance = self.euclidean(output_x, output_y)
if train:
loss = self.loss(distance, self.euclidean(x, y))
return loss
else:
return self.similarity(float(distance))

Profiler

参考文档:PyTorch Profiler — PyTorch Tutorials 2.1.0+cu121 documentation

基础知识

pytorch profiler通过上下文管理器开启,可以接收很多设置参数,比如:

  • activities - 分析活动的列表
    • ProfilerActivity.CPU - Pytorch操作符,TorchScript函数,和用户定义的代码标签(见下面的record_function
    • ProfileActivity.CUDA - 设备上的CUDA内核
  • record_shapes - 是否记录每次操作的输入的形状
  • profile_memory - 是否报告模型张量消耗的内存量
  • use_cuda - 是否测量CUDA内核的执行时间

注意:当使用CUDA时,profiler还会展示主机上发生的运行时CUDA事件。

导入库

1
2
3
import torch
import torchvision.models as models
from torch.profiler import profile, record_function, ProfilerActivity

实例化一个简单的Resnet模型

1
2
model = models.resnet18() # 在CPU上
inputs = torch.randn(5, 3, 224, 224)

使用profiler分析执行时间

only CPU

1
2
3
with profile(activities=[ProfilerActivity.CPU], record_shapes=True) as prof:
with record_function("model_inference"):
model(inputs)

从上面我们可以看到,我们可以通过record_function上下文管理器,使用用户提供的名字来标记任意代码范围(在上面的例子中,model_inference被用作标签)。

在执行被上下文管理器包装的代码范围期间,profiler允许检查哪些操作符被调用了。如果多个profiler范围同时处于活动(active)状态(例如,在并行的pytorch线程中),则每个profiling上下文管理器仅跟踪其相应范围的运算。

Profiler还会自动评测使用torch.jit_fork启动的异步任务,以及(在向后传递的情况下)用backward()调用启动的向后传递运算符。

下面打印以上执行的数据:

1
print(prof.key_averages())

1
print(prof.key_averages().table(sort_by="cpu_time_total", row_limit=10))

输出如下:

1
2
3
4
5
6
7
8
9
10
11
12
13
14
15
---------------------------------  ------------  ------------  ------------  ------------  ------------  ------------  
Name Self CPU % Self CPU CPU total % CPU total CPU time avg # of Calls
--------------------------------- ------------ ------------ ------------ ------------ ------------ ------------
model_inference 2.88% 4.048ms 100.00% 140.643ms 140.643ms 1
aten::conv2d 0.10% 140.000us 65.89% 92.664ms 4.633ms 20
aten::convolution 0.34% 485.000us 65.79% 92.524ms 4.626ms 20
aten::_convolution 0.18% 255.000us 65.44% 92.039ms 4.602ms 20
aten::mkldnn_convolution 64.72% 91.030ms 65.26% 91.784ms 4.589ms 20
aten::max_pool2d 0.03% 36.000us 14.84% 20.866ms 20.866ms 1
aten::max_pool2d_with_indices 14.81% 20.830ms 14.81% 20.830ms 20.830ms 1
aten::batch_norm 0.20% 277.000us 12.02% 16.899ms 844.950us 20
aten::_batch_norm_impl_index 0.17% 234.000us 11.95% 16.813ms 840.650us 20
aten::native_batch_norm 11.59% 16.301ms 11.77% 16.551ms 827.550us 20
--------------------------------- ------------ ------------ ------------ ------------ ------------ ------------
Self CPU time total: 140.643ms

可以看到,aten::mkldnn_convolution函数的Self CPU最高。

其中 Self CPU 和 CPU 的区别在于,前者减去了子操作的执行时间,后者保留了子操作的执行时间。

可以在table()中使用sort_by="self_cpu_time_total“,根据 self cpu 时间对输出进行排序。

为了获得更细粒度的输出,包含操作输入的形状,可以使用group_by_input_shape(要求运行profiler时开启record_shapes=True):

1
print(prof.key_averages(group_by_input_shape=True)).table(sort_by="self_cpu_time_total", row_limit=10)

输出如下(省略了一些列):

1
2
3
4
5
6
7
8
9
10
11
12
13
14
15
---------------------------------  ------------  ------------ ... ----------------------------------------------------------  
Name Self CPU % Self CPU ... Input Shapes
--------------------------------- ------------ ------------ ... ----------------------------------------------------------
aten::mkldnn_convolution 19.26% 22.064ms ... [[5, 64, 56, 56], [64, 64, 3, 3], [], [], [], [], []]
aten::max_pool2d_with_indices 15.51% 17.759ms ... [[5, 64, 112, 112], [], [], [], [], []]
aten::mkldnn_convolution 10.50% 12.026ms ... [[5, 512, 7, 7], [512, 512, 3, 3], [], [], [], [], []]
aten::mkldnn_convolution 10.10% 11.566ms ... [[5, 256, 14, 14], [256, 256, 3, 3], [], [], [], [], []]
aten::mkldnn_convolution 6.59% 7.553ms ... [[5, 128, 28, 28], [128, 128, 3, 3], [], [], [], [], []]
aten::mkldnn_convolution 6.49% 7.428ms ... [[5, 3, 224, 224], [64, 3, 7, 7], [], [], [], [], []]
aten::native_batch_norm 3.30% 3.777ms ... [[5, 128, 28, 28], [128], [128], [128], [128], [], [], []]
aten::mkldnn_convolution 3.20% 3.660ms ... [[5, 256, 14, 14], [512, 256, 3, 3], [], [], [], [], []]
model_inference 3.16% 3.616ms ... []
aten::mkldnn_convolution 3.10% 3.552ms ... [[5, 128, 28, 28], [256, 128, 3, 3], [], [], [], [], []]
--------------------------------- ------------ ------------ ... ----------------------------------------------------------
Self CPU time total: 114.529ms

with GPU

profiler也可以用来分析在GPU上执行的模型的性能:

1
2
3
4
5
6
7
model = models.resnet18().cuda()
inputs = torch.randn(5, 3, 224, 224).cuda()

with profile(activities=[ProfilerActivity.CPU, ProfilerActivity.CUDA], record_shapes=True) as prof:
with record_function("model_inference"):
model(inputs)
print(prof.key_averages().table(sort_by="cuda_time_total", row_limit=10))

输出如下(省略了一些行):

1
2
3
4
5
6
7
8
9
10
11
12
13
14
15
16
----------------------------  ----------  --------- ----------  -----------  ----------  ------------  ----------
Name Self CPU % Self CPU Self CUDA Self CUDA % CUDA total CUDA time avg # of Calls
---------------------------- ---------- --------- ---------- ----------- ---------- ------------ ----------
model_inference 0.79% 3.720ms 258.000us 0.07% 346.300ms 346.300ms 1
aten::conv2d 0.03% 151.000us 102.000us 0.03% 289.635ms 14.482ms 20
aten::convolution 0.09% 418.000us 98.000us 0.03% 289.533ms 14.477ms 20
aten::_convolution 0.07% 332.000us 98.000us 0.03% 289.435ms 14.472ms 20
aten::cudnn_convolution 87.95% 412.414ms 289.337ms 83.55% 289.337ms 14.467ms 20
aten::add_ 2.19% 10.283ms 32.463ms 9.37% 32.463ms 1.159ms 28
aten::batch_norm 0.02% 111.000us 91.000us 0.03% 10.973ms 548.650us 20
aten::_batch_norm_impl_index 0.04% 207.000us 99.000us 0.03% 10.882ms 544.100us 20
aten::cudnn_batch_norm 4.35% 20.415ms 10.402ms 3.00% 10.783ms 539.150us 20
aten::max_pool2d 0.01% 32.000us 4.000us 0.00% 4.379ms 4.379ms 1
---------------------------- ---------- --------- ---------- ----------- ---------- ------------ ----------
Self CPU time total: 468.945ms
Self CUDA time total: 346.300ms

注:第一次使用cuda profiling会引入额外的开销,导致运行时间较长,之后就相对正常了:

1
2
Self CPU time total: 192.059ms
Self CUDA time total: 155.963ms

使用profiler分析内存开销

profiler能够统计模型运行过程中tensor使用获释放的内存数量,profile_memory=True

1
2
3
4
5
6
7
8
9
10
11
12
13
14
15
16
17
18
19
20
21
22
23
24
25
26
27
28
29
30
31
32
33
34
35
36
37
38
39
40
41
42
43
44
45
46
import torch
import torchvision.models as models
from torch.profiler import profile, record_function, ProfilerActivity

model = models.resnet18()
inputs = torch.randn(5, 3, 224, 224)

with profile(activities=[ProfilerActivity.CPU], record_shapes=True, profile_memory=True) as prof:
with record_function("model_inference"):
model(inputs)

print(prof.key_averages().table(sort_by="self_cpu_memory_usage", row_limit=10))
# (omitting some columns)
# --------------------------------- ------------ ------------ ------------ ------------ ------------
# Name Self CPU % Self CPU CPU Mem Self CPU Mem # of Calls
# --------------------------------- ------------ ------------ ------------ ------------ ------------
# aten::empty 0.31% 403.000us 94.35 Mb 94.35 Mb 200
# aten::max_pool2d_with_indices 18.90% 24.260ms 11.48 Mb 11.48 Mb 1
# aten::empty_like 0.05% 60.000us 47.37 Mb 490.00 Kb 20
# aten::addmm 0.24% 302.000us 19.53 Kb 19.53 Kb 1
# aten::mean 0.05% 61.000us 10.00 Kb 10.00 Kb 1
# aten::empty_strided 0.01% 7.000us 4 b 4 b 1
# aten::conv2d 0.13% 173.000us 47.37 Mb 0 b 20
# aten::convolution 0.29% 375.000us 47.37 Mb 0 b 20
# aten::_convolution 0.17% 224.000us 47.37 Mb 0 b 20
# aten::mkldnn_convolution 60.82% 78.050ms 47.37 Mb 0 b 20
# --------------------------------- ------------ ------------ ------------ ------------ ------------
# Self CPU time total: 128.330ms

print(prof.key_averages().table(sort_by="cpu_memory_usage", row_limit=10))
# (omitting some columns)
# --------------------------------- ------------ ------------ ------------ ------------ ------------
# Name Self CPU % Self CPU CPU Mem Self CPU Mem # of Calls
# --------------------------------- ------------ ------------ ------------ ------------ ------------
# aten::empty 0.31% 403.000us 94.35 Mb 94.35 Mb 200
# aten::batch_norm 1.19% 1.528ms 47.41 Mb 0 b 20
# aten::_batch_norm_impl_index 0.21% 272.000us 47.41 Mb 0 b 20
# aten::native_batch_norm 10.43% 13.379ms 47.41 Mb -47.00 Kb 20
# aten::conv2d 0.13% 173.000us 47.37 Mb 0 b 20
# aten::convolution 0.29% 375.000us 47.37 Mb 0 b 20
# aten::_convolution 0.17% 224.000us 47.37 Mb 0 b 20
# aten::mkldnn_convolution 60.82% 78.050ms 47.37 Mb 0 b 20
# aten::empty_like 0.05% 60.000us 47.37 Mb 490.00 Kb 20
# aten::max_pool2d 0.02% 20.000us 11.48 Mb 0 b 1
# --------------------------------- ------------ ------------ ------------ ------------ ------------
# Self CPU time total: 128.330ms

使用跟踪功能

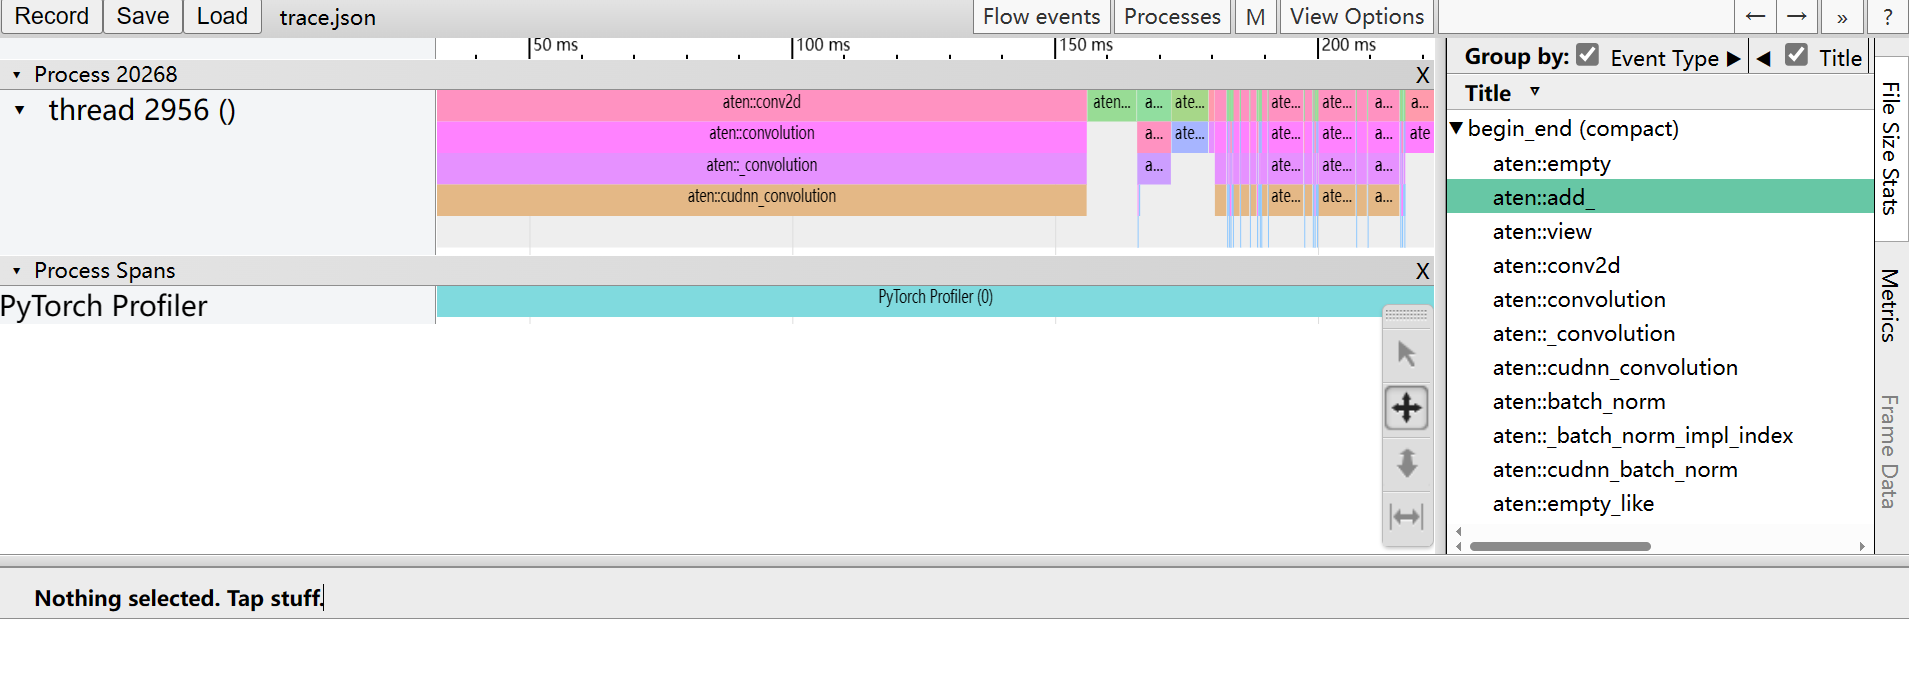
通过export_chrome_trace,profiler的分析结果能够输出为一个.json(跟踪)文件。

1
2
3
4
5
6
7
model = models.resnet18().cuda()
inputs = torch.randn(5, 3, 224, 224).cuda()

with profile(activities=[ProfilerActivity.CPU, ProfilerActivity.CUDA]) as prof:
model(inputs)

prof.export_chrome_trace("trace.json")

在浏览中访问chrome//tracingedge://tracing,加载生成的trace.json文件,界面如下:

edge-tracing

检查栈跟踪

Profiler能够被用来分析Python和TorchScript的栈跟踪:

1
2
3
4
5
6
7
with profile(
activities=[ProfilerActivity.CPU, ProfilerActivity.CUDA],
with_stack=True
) as prof:
model(inputs)

print(prof.key_averages(group_by_stack_n=5).table(sort_by="self_cuda_time_total", row_limit=2))

【测试失败!】(未输出堆栈信息)

将数据可视化为火焰图

执行时间(self_cpu_time_totalself_cuda_time_total)和栈跟踪能够被可视化为一个火焰图。

首先使用export_stacks导出原始数据(需要with_stack=True

1
prof.export_stacks("./profiler_stacks.txt", "self_cuda_time_total")

【测试失败!】(生成的文件为空)

推荐使用 Flamegraph tool 生成一个可交互的.svg文件

1
2
3
git clone https://github.com/brendangregg/FlameGraph
cd FlameGraph
./flamegraph.pl --title "CUDA time" --countname "us." /tmp/profiler_stacks.txt > perf_viz.svg

使用profiler分析长时间运行的工作

Pytorch profiler提供一个额外的API用于处理长时间运行的工作(如训练循环)。如果跟踪所有的执行,会很慢,生成的跟踪文件也会很大。为了避免这样,可以使用以下可选参数:

  • schedule - 指定一个以整数参数(步长)为输入的函数,如 torch.profiler.schedule帮助函数,生成一个shcedule。
  • on-trace-ready - 指定一个以profiler引用为输入的回调函数,每次当新跟踪准备好时,去调用该函数

首先考虑以下示例:

1
2
3
4
5
6
7
8
from torch.profiler import schedule

my_schedule = schedule(
skip_first=10, # 跳过前10步
wait=5, # 每轮前5步空转等待
warmup=1, # 1步热身,测量但不记录,丢掉刚开始测量时由于额外开销导致的不准确的数据
active=3, # 3步活动,测量并记录
repeat=2) # 可选参数,最多两轮

下面是更完整的示例:

1
2
3
4
5
6
7
8
9
10
11
12
13
14
15
16
def trace_handler(p):
output = p.key_averages().table(sort_by="self_cuda_time_total", row_limit=10)
print(output)
p.export_chrome_trace("./trace_" + str(p.step_num) + ".json")

with profile(
activities=[ProfilerActivity.CPU, ProfilerActivity],
schedule=torch.profiler.schedule(
wait=1,
warmup=2,
active=2),
on_trace_ready=trace_handler
) as p:
for idx in range(8):
model(inputs)
p.step() # 告诉profiler,到下一步了。增加p.step_num计数